CAC Payback Period: What It Is, Why It’s Killing Your Series B Valuation, and How to Fix It

Updated: Jul 16
Your Series B deck shows $15M ARR growing 80 percent year over year. Impressive headline. Then the investor flips to the unit economics slide and sees a CAC payback period of 22 months.
The conversation changes. The investor is no longer evaluating a growth story. They are evaluating a cash-burn story. At 22 months payback, the company must survive nearly two years before each new customer contributes net cash. At the current growth rate, that means the company will need significantly more capital to sustain the GTM engine — capital the investor will be diluted to provide. The valuation multiple drops. The term sheet gets tougher. Or the round does not happen.
CAC payback period is the single metric that most directly determines whether a SaaS company’s growth is an asset or a liability. Below 12 months, growth is capital-efficient and self-funding. Above 18 months, growth consumes cash faster than it generates returns. Above 24 months, most investors will not fund the next round at the valuation the founder expects.
Understanding what CAC payback is, where the benchmarks sit, how it affects valuation, and how to compress it is not optional for Series B SaaS founders. It is the difference between a fundraise that accelerates the company and one that stalls it.
What is CAC payback period in SaaS?
CAC payback period measures how many months of gross margin contribution from a new customer are required to recoup the cost of acquiring that customer. It is the speed at which the company earns back its customer acquisition investment.
The formula:
CAC payback (months) = CAC ÷ (ARPA × gross margin %)
Where CAC is the fully-loaded cost of acquiring one new customer (all marketing and sales expenses divided by the number of new customers acquired), ARPA is the average revenue per account per month, and gross margin percentage is the portion of revenue remaining after cost of goods sold.

Two nuances matter for accuracy. First, CAC must be fully loaded. This means all marketing spend (paid, content, tools, headcount), all sales spend (AE compensation, SDR compensation, sales tools, commissions), and any revenue operations overhead. Companies that calculate CAC using only marketing spend understate the real acquisition cost — sometimes by 40 to 60 percent — and present artificially low payback periods that collapse under investor scrutiny.
Second, CAC payback should be calculated by channel. The blended number is useful for the board deck, but the channel-level view is what drives budget decisions. Google paid search might have a 7-month payback while LinkedIn paid sits at 19 months. The blended number (say, 13 months) hides the fact that one channel is highly efficient and another is burning cash. Without channel-level disaggregation, the CMO cannot rationally allocate the next marginal dollar of spend.
What is a good CAC payback period for Series B?
Benchmarks vary by deal size, sales motion, and market segment. But investor expectations at Series B have converged around clear thresholds.
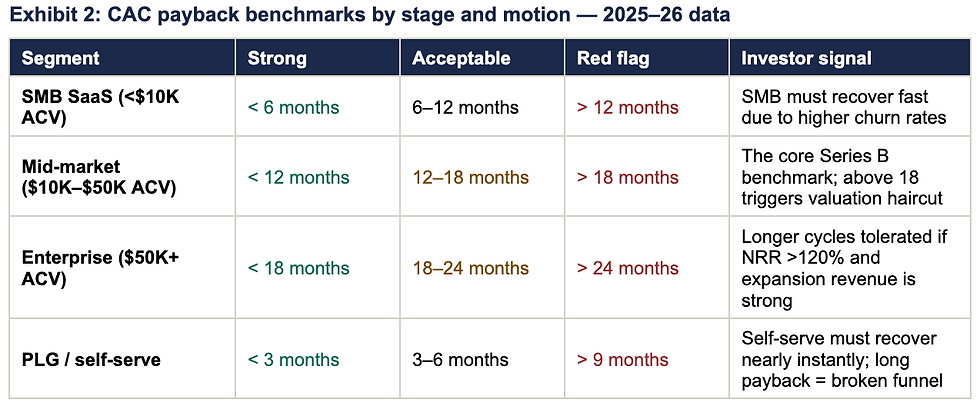
For the typical mid-market Series B SaaS company — $10K to $50K ACV, sales-led or hybrid motion — the threshold is clear: below 12 months is strong, 12 to 18 is acceptable, above 18 is a red flag. Investors at Series B are underwriting the company’s ability to scale revenue capital-efficiently. A payback period above 18 months tells them the GTM engine consumes more cash than it generates — and the company will need another raise sooner than planned, at worse terms.
Partners Capital’s Insights 2026 notes that global venture fundraising hit its lowest point since 2017, with first-time managers raising just $4.8 billion across 68 funds. In this capital-scarce environment, investors have no patience for inefficient acquisition economics. The CAC payback threshold is not a suggestion. It is a gating criterion.
How does CAC affect SaaS valuation?
CAC payback does not appear directly in a valuation formula. But it influences the two variables that do: revenue multiple and investor confidence in forward projections.
The revenue multiple effect
SaaS companies are valued on revenue multiples — enterprise value as a multiple of ARR or forward revenue. The multiple reflects the market’s confidence in the durability and efficiency of the company’s growth. A company growing 80 percent year over year with 9-month CAC payback commands a materially higher multiple than one growing 80 percent with 22-month payback, because the former’s growth is self-funding and the latter’s is capital-dependent.
In practice, the difference is significant. SaaS companies with CAC payback under 12 months and NRR above 110 percent consistently trade at the top quartile of revenue multiples for their growth rate. Those with payback above 18 months trade at bottom-quartile multiples — or struggle to close rounds at all.
The cash runway effect
CAC payback directly determines how much capital the company needs to fund its growth plan. At 9-month payback, a company that spends $150K per month on acquisition recovers its investment within the fiscal year. The cash is recycled into the next cohort of customers. Growth is partially self-financing.
At 22-month payback, the same $150K per month does not come back for nearly two years. The company must fund 22 months of acquisition investment from runway before seeing a return. At scale, this means the company burns through its Series A capital faster than planned and arrives at the Series B raise from a position of weakness — needing capital to survive rather than to accelerate. Investors price that desperation into the terms.
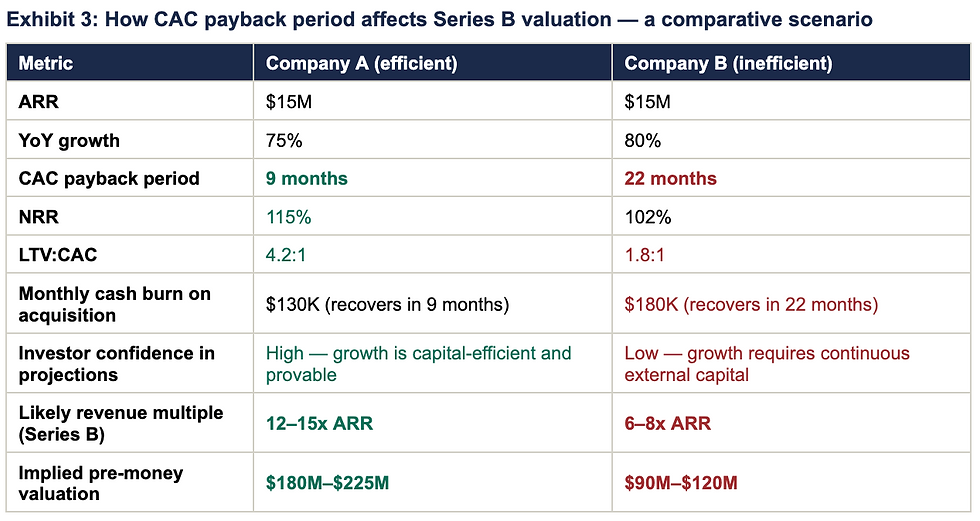
The worked example makes the stakes concrete. Both companies have $15M ARR and similar growth rates. But Company A’s 9-month CAC payback and 115 percent NRR signal a capital-efficient engine that can scale without proportional capital increases. Company B’s 22-month payback and 102 percent NRR signal a cash-consuming engine that requires continuous external funding. The valuation difference — $180M–$225M versus $90M–$120M — is not a rounding error. It is a $60M to $105M difference in pre-money valuation driven primarily by the efficiency of the acquisition engine.
How do you reduce CAC payback period?
CAC payback has three levers: reduce CAC, increase ARPA, or improve gross margin. The fastest and most controllable lever for a marketing leader is reducing CAC — specifically, reducing it without proportionally reducing pipeline volume.
Seven interventions compress CAC payback. They are ranked by typical speed of impact.

Channel rationalisation is the fastest intervention because it requires no new infrastructure — only the attribution data to identify which channels are efficient and which are not. Most Series A–C companies discover during an attribution audit that 30 to 40 percent of spend flows to channels where payback exceeds 18 months or cannot be measured at all. Reallocating that spend to proven channels produces a measurable CAC reduction within 60 days.
ICP precision is the highest-leverage intervention because it affects every stage of the funnel simultaneously. When targeting narrows to the segments where the company actually wins — derived from closed-won data, not assumptions — conversion rates improve at every stage, deal sizes increase (because the company is selling to better-fit customers), and sales cycles shorten. The compounding effect across the funnel can cut CAC by 40 to 60 percent when the ICP was previously very broad.
Funnel conversion optimisation targets the single stage where the most pipeline leaks. In most SaaS companies, this is either the MQL-to-SQL conversion (marketing sends leads that sales rejects or ignores) or the SQL-to-Opportunity conversion (qualified leads stall because the discovery process is unstructured). Fixing the largest leakage point by even 5 percentage points can produce a 20 percent or greater reduction in effective CAC.
AI-driven lead scoring is increasingly accessible at the Series B stage. McKinsey’s Global Tech Agenda 2026 reports that half of all companies now identify AI as their top investment priority, with 28 percent of top performers planning to increase tech budgets by more than 10 percent. For SaaS GTM teams, AI-driven scoring concentrates sales effort on the roughly 5 percent of accounts that are in-market at any given time, producing a 15 to 20 percent lift in sales productivity. Fewer wasted sales hours means lower CAC.
Pricing and packaging optimisation attacks the denominator rather than the numerator. Increasing ARPA from $2,000 to $2,500 per month compresses CAC payback by 20 percent without changing anything about the acquisition engine. This is often the most overlooked lever because it requires cross-functional coordination between product, sales, and marketing — but value-based pricing adjustments can be tested and validated within a single quarter.
CAC payback is not a marketing metric. It is a valuation metric.
The difference between a $180M and a $90M Series B valuation can come down to one number: how many months until each new customer pays for themselves. Every month of CAC payback beyond the 12-month threshold represents capital consumed, runway shortened, and investor confidence eroded.
The fix is systematic, not tactical. It starts with attribution infrastructure that disaggregates CAC by channel. It continues with ICP precision that concentrates spend on the segments that convert. It extends through funnel optimisation, SLA enforcement, and AI-driven prioritisation that squeezes waste out of every stage of the pipeline.
A fractional CMO who has compressed CAC payback across multiple SaaS scaleups brings the diagnostic framework to identify which of the seven levers will produce the largest impact for your specific situation — and the operational playbook to execute the compression within 90 days. For Series B companies where the next raise depends on proving capital-efficient growth, this is not a nice-to-have optimisation. It is the intervention that determines whether the round happens at the valuation the founder needs.
A free 30-minute session that calculates your blended and channel-level CAC payback, benchmarks it against Series B standards, and identifies the single highest-impact lever for compression. No pitch. Just the numbers.
Sources: McKinsey & Company, Global Private Markets Report 2026; McKinsey Global Tech Agenda 2026; Partners Capital, Insights 2026; Bain & Company Commercial Excellence Benchmark; SaaS GTM benchmarks 2025–26 (SaaSHero, Envizon).



Comments