The 20-Point RevOps Audit: How to Diagnose Funnel Friction and Fix Broken GTM Operations

Most operational fixes are answers to undiagnosed problems, which is why the same meeting recurs six months later with a larger tool stack. A structured audit across five dimensions and twenty questions produces something a maturity score does not: a ranked list of what is broken and what closing each gap is worth. The pattern of failures is more diagnostic than the total, because failures cluster and the cluster identifies the cause. The audit's output should be three items with owners and dates, not twenty.
Most operational fixes fail because they are answers to undiagnosed problems. A company notices that its forecast is unreliable and buys forecasting software. It notices that leads are not being worked and buys a sequencing tool. It notices that reporting takes too long and hires an analyst. Each response is reasonable. Each treats a symptom that originates two layers upstream, which is why six months later the same meeting happens again with a larger tool stack.
An audit is the alternative. Not a maturity score for its own sake — a scored assessment that nobody acts on is a slower way of doing nothing — but a structured examination that produces a ranked list of what is actually broken and what closing each gap is worth.
What follows is the structure we use, organised across five dimensions, twenty questions in total. Answer each honestly on a three-point basis: this is in place and working, this exists but is not enforced, this does not exist. The pattern of your answers is more diagnostic than the total.
Why dimensions rather than a list
The reason to organise an audit by dimension rather than as a flat checklist is that failures cluster, and the cluster tells you the cause.
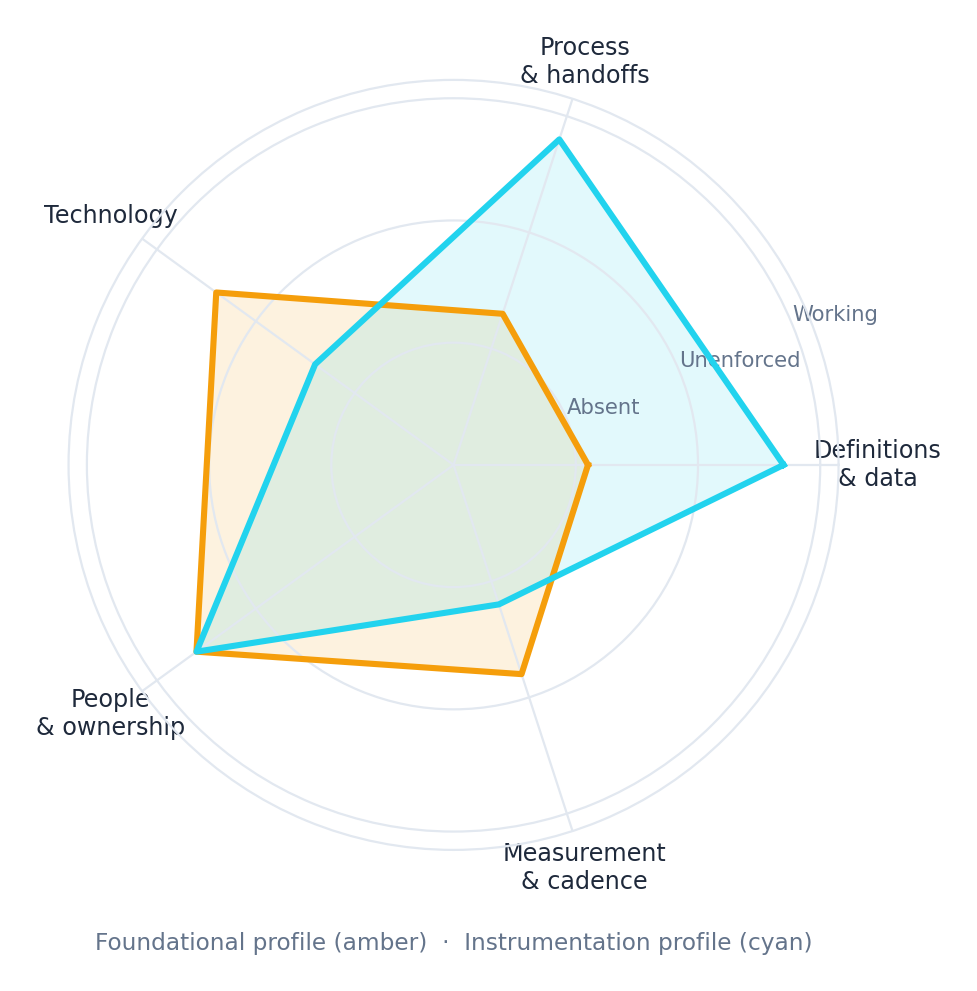
The dimensions that matter, drawn from the operational maturity research and consistent with what the practitioner studies find, are collaboration between revenue functions, the existence of a genuine single source of truth, clear ownership of revenue responsibility, alignment of the technology stack, alignment of planning and process, and alignment of goals and incentives. The ProfitWell and HubSpot state-of-RevOps work frames maturity across roughly this set; Forrester's own B2B revenue operations maturity assessment runs across seven categories with a similar underlying logic. The specific taxonomy matters less than the principle: a company failing across four questions in one dimension has a structural problem, while a company failing one question in each of four dimensions has four independent maintenance items.
EXHIBIT 1
Two companies with identical scores and entirely different problems
Dimension one: definitions and data (questions 1–4)
1. Does a qualified lead have a written definition that both marketing and sales have signed off on?
Not a shared understanding. A document, with criteria, that a new hire could apply on their second day and reach the same conclusion an experienced person would. The absence of this is the single most common root cause in the audits we run, and it produces contradictory downstream symptoms — marketing reporting strong lead volume while sales reports weak lead quality — that get argued about as a performance issue for years.
2. Can any question about revenue be answered from one system without reconciliation?
Test it directly. Ask for closed revenue by segment for the last quarter and see how many systems are consulted and whether the answers agree. If the answer requires a spreadsheet that combines exports, you do not have a single source of truth. You have several sources and a person who reconciles them, and that person is a single point of failure.
3. Is data quality prevented at entry rather than remediated in batches?
Validation at creation, duplicate detection at the point of entry, enrichment that populates firmographics automatically, and standardised values rather than free text for anything that will be grouped. Remediation without prevention regenerates the backlog at exactly the rate you clear it.
4. Do pipeline stages have exit criteria based on verified buyer behaviour?
The test is whether each criterion describes something the buyer did or something the seller believes. Every stage defined on seller belief introduces variance that no downstream model can remove.
Dimension two: process and handoffs (questions 5–8)
5. Is every handoff in the revenue lifecycle documented with an owner, a payload, and a service level?
Marketing to sales, SDR to account executive, closed-won to onboarding, onboarding to success, success to renewal. Five transitions minimum. Undocumented handoffs are where context dies, and the customer experiences its death as being asked to repeat themselves.
6. Does an ageing rule force disposition on stalled opportunities?
Not automatic closure — reps will game automatic closure by touching records. A forced decision: advance, push with a documented reason, or lose. Without this, pipeline inflates monotonically and every coverage ratio you calculate is optimistic by an unknown margin.
7. Do contract terms flow from the CRM to billing and provisioning without re-keying?
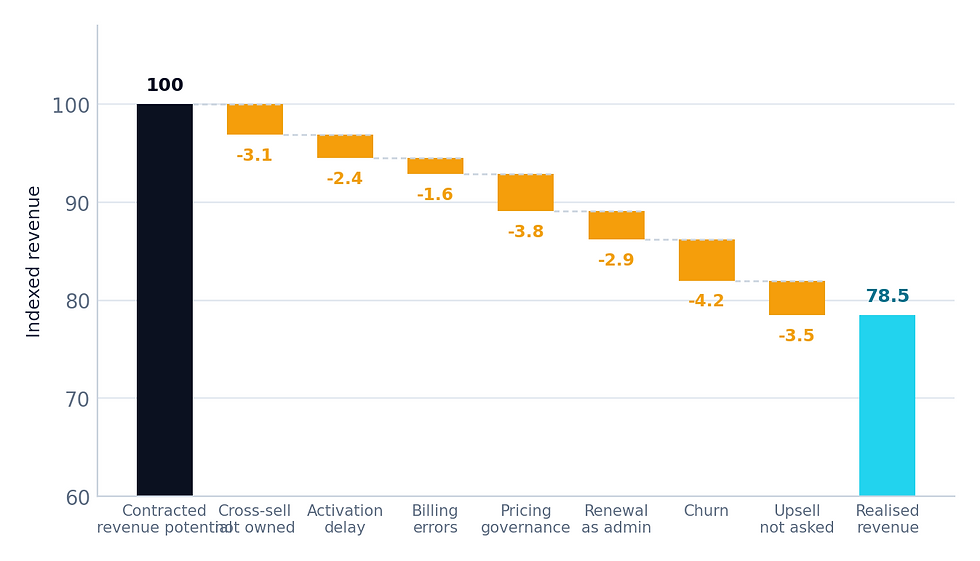
Every transcription point is an error rate and a delay. This question is a proxy for whether your back end is connected at all, and the answer tends to correlate with billing accuracy, activation speed, and how often finance and sales disagree.
8. Is there an enforced discount approval structure, and does the realised discount distribution show it working?
The evidence is in the distribution, not the policy. A cluster of deals just below the approval threshold means the threshold is being managed to rather than respected.
Dimension three: technology (questions 9–12)
9. Does each object have exactly one system of record?
Contacts, accounts, opportunities, activity, product and pricing, contract terms, usage. One home each; everything else reads from it. Where two systems both claim authority over the same object, you have a permanent reconciliation cost.
10. Are more than a third of your custom CRM fields populated on fewer than one in ten records?
Run the report. Field sprawl is the most common cause of adoption decay, because every unused field on a page layout increases the friction of the fields that matter.
11. Are you paying for overlapping tools, or for platform capability you already own and are not using?
Both are common and both are usually discovered only when someone deliberately looks.
12. Is your automation layer inspectable — can you determine why a specific record was routed the way it was?
Automation that cannot explain its decisions cannot be improved and will not be trusted. When a good lead goes to the wrong place and nobody can say why, the team stops relying on the system, which returns you to manual triage with extra steps.
Dimension four: people and ownership (questions 13–16)
13. Does someone own revenue operations across the full lifecycle rather than within one function?
This is the quarterback question. Revenue operations exists to align functional leaders around a shared operating picture and to arbitrate between them when their local optima conflict. A function that reports inside sales cannot arbitrate between sales and marketing, regardless of its mandate on paper.
14. Are goals and incentives aligned across functions, or does each team's optimum degrade the others'?
Trace it concretely. If marketing is measured on lead volume and sales on closed revenue and success on retention, model what happens when each maximises. Marketing lowers the qualification bar, sales works only the fastest-converting segments, success absorbs the cost of accounts that should not have been sold. Everyone hits their number. Blended economics deteriorate.
15. Is there information asymmetry at your friction points — do the people at each contact point have what they need?
Friction at a handoff has two possible causes: the tooling does not surface the information, or the person in the role cannot use it. These require different remedies and are frequently misdiagnosed as each other. A rep who consistently mishandles a stage may be badly supported rather than badly suited, and the reverse is also true.
16. Does an operational request have a defined intake path and a stated turnaround?
When requests arrive by direct message and are handled by whoever is available, work is prioritised by proximity and volume rather than by value, and the operations function becomes reactive permanently.
Dimension five: measurement and cadence (questions 17–20)
17. Do you track forecast variance historically — what you said versus what landed, over at least four quarters?
This is the credibility metric. It is also the one most often absent, because early results are unflattering. They are unflattering for everyone, and the trend is what matters.
18. Do you measure time-based operational metrics, not only revenue outcomes?
Speed to first contact, days in stage, days from close to provisioned, hours per week per rep on administration. Revenue is lagging and contested. Time metrics are measurable within the month and attributable to a specific change, which is how operational work demonstrates value before the revenue effect arrives.
19. Are structured loss reasons captured and analysed quarterly?
A short mutually exclusive picklist plus a comment field, enforced at closure. Free-text loss reasons are unanalysable, which means unanalysed, which means the field decays into noise.
20. Does the reporting layer answer the question "what should we do differently", or only "what happened"?
This is the question that separates a dashboard from an instrument. Most reporting describes the past accurately and implies no action. If your weekly revenue review produces discussion but not decisions, the reporting is the reason.
Reading the results
The value is in the pattern.
Concentrated failure in dimensions one and two — definitions and process — means you have a foundational problem, and no amount of tooling or analytics investment will help until it is addressed. This is the most common profile in companies between five and twenty million in ARR, and it is good news, because foundational work is well understood and fast.
Concentrated failure in dimension three with dimensions one and two intact means you have accumulated technical debt rather than operating debt. This is a consolidation and rebuild project with a clear scope.
Concentrated failure in dimension four is the hardest and most consequential, because it is organisational rather than technical. No system design survives misaligned incentives; the incentives will be satisfied and the system will be worked around.
Concentrated failure in dimension five with the others intact is the best position to be in. It means the machine works and you cannot see it, which is a reporting and instrumentation project rather than a rebuild.
EXHIBIT 2
Reading the pattern: where the failures cluster tells you what kind of programme you need
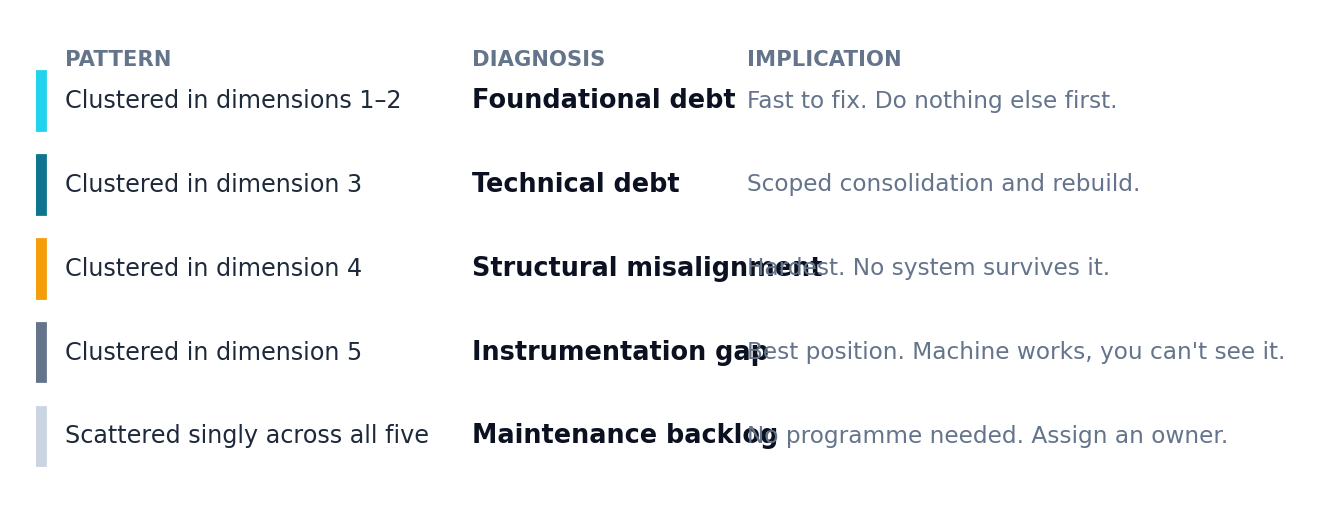
Scattered single failures across all five dimensions usually indicate a company that is operating adequately and does not need a transformation programme. It needs a maintenance backlog and someone to own it.
From findings to a value stream map
The audit tells you what is broken. It does not tell you what fixing it is worth, and without that, prioritisation defaults to whichever problem is currently loudest.
The bridge is a value stream map of the specific process containing your worst-scoring failures. Document the current state as it actually runs, not as the process document claims: every step, every system touched, every wait, every handoff, every point where a human transcribes something a machine could have carried. Attach two numbers to each step — elapsed time and touch time. The gap between them is where the opportunity is, because it is almost always dominated by waiting rather than working.
EXHIBIT 3
The gap between elapsed and touch time is the business case
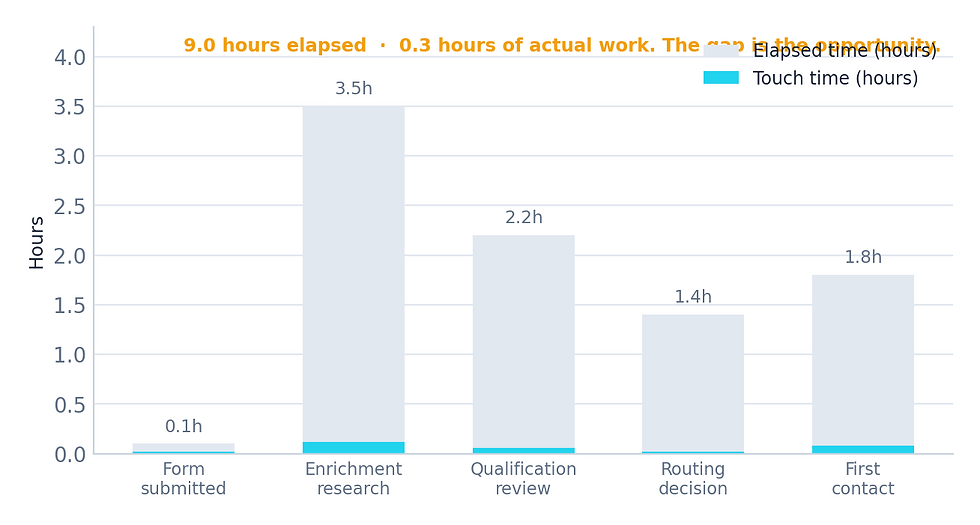
That map produces a quantified target. If a lead currently takes nine hours to reach a rep with context, of which eleven minutes is actual work, you now know both what the compression is worth and where it comes from. That is a business case rather than an assertion, and it is what makes the difference between an audit that produces action and one that produces a document.
What to do first
Three findings, ranked by value, with an owner and a date. Not twenty. A remediation list with twenty items is a list nobody starts, and the most common way an audit fails is by being too thorough to act on.
Close those three. Re-measure. Then take the next three. Operational improvement compounds when it is sequential and evaporates when it is simultaneous.
Questions for your next leadership review
Which dimension holds your cluster? The pattern, not the score, determines whether you need a rebuild, a consolidation, an organisational change, or simply an owner.
For your worst-scoring process, what is the ratio of elapsed time to touch time? That ratio is the business case, and it is almost always dominated by waiting rather than working.
Which three findings will have owners and dates by Friday? A remediation list of twenty is a list nobody starts.
How we run it
The audit is where every RevOps Quantum engagement starts, and we run it before proposing any work, because we would rather tell a company that its problem is three specific handoffs than sell it a platform rebuild it does not need.
The RevQ Model is the framework underneath it: three layers — Signal, Conversion, and Action — read across four revenue states of Acquire, Convert, Expand, and Scale. It exists to locate the constraint rather than describe the whole system, because knowing everything about your revenue engine is not useful and knowing the one thing that is limiting it is.
Where the finding is that manual work is the constraint, the Quantum Engine is what replaces it — listening for signals across the stack, enriching at creation, scoring against real conversion patterns, and routing with the reasoning attached.
Our pricing is published on our site, including for the audit.

Comments